This website is managed by Ultima Markets’ international entities, and it’s important to emphasise that they are not subject to regulation by the FCA in the UK. Therefore, you must understand that you will not have the FCA’s protection when investing through this website – for example:
You will not be guaranteed Negative Balance Protection
You will not be protected by FCA’s leverage restrictions
You will not have the right to settle disputes via the Financial Ombudsman Service (FOS)
You will not be protected by Financial Services Compensation Scheme (FSCS)
Any monies deposited will not be afforded the protection required under the FCA Client Assets Sourcebook. The level of protection for your funds will be determined by the regulations of the relevant local regulator.
Note: UK clients are kindly invited to visit https://www.ultima-markets.co.uk/. Ultima Markets UK expects to begin onboarding UK clients in accordance with FCA regulatory requirements in 2026.
If you would like to proceed and visit this website, you acknowledge and confirm the following:
1.The website is owned by Ultima Markets’ international entities and not by Ultima Markets UK Ltd, which is regulated by the FCA.
2.Ultima Markets Limited, or any of the Ultima Markets international entities, are neither based in the UK nor licensed by the FCA.
3.You are accessing the website at your own initiative and have not been solicited by Ultima Markets Limited in any way.
4.Investing through this website does not grant you the protections provided by the FCA.
5.Should you choose to invest through this website or with any of the international Ultima Markets entities, you will be subject to the rules and regulations of the relevant international regulatory authorities, not the FCA.
Ultima Markets wants to make it clear that we are duly licensed and authorised to offer the services and financial derivative products listed on our website. Individuals accessing this website and registering a trading account do so entirely of their own volition and without prior solicitation.
By confirming your decision to proceed with entering the website, you hereby affirm that this decision was solely initiated by you, and no solicitation has been made by any Ultima Markets entity.
Ultima Markets does not have an establishment in Singapore and does not operate from Singapore.
Ultima Markets does not provide products or services to citizens or residents of Singapore, and account applications from Singapore citizens or residents will not be accepted.
If you are a citizen or resident of Singapore, please do not open an account or use Ultima Markets’ products or services.
By selecting “Acknowledge and Continue Browsing”, you confirm that you are accessing this website on your own initiative and that your access is not the result of any direct marketing, targeted advertising, solicitation, or promotional activity by Ultima Markets.
Nothing on this website constitutes an offer, solicitation, or promotion of products or services in any jurisdiction where such activity is prohibited. You are responsible for ensuring that your access to and use of this website complies with applicable local laws and regulations.
Unlock the power of bearish divergence to spot trend reversals early! Learn proven strategies and risk management tips to maximise your trading profits.
How to Spot and Trade Bearish Divergence
Bearish divergence is one of the most popular and effective tools used by traders to identify potential market reversals. It provides an early signal that an existing trend may soon reverse or consolidate. By understanding how to spot bearish divergence and trade it properly, traders can position themselves to take advantage of market shifts with low-risk opportunities.
In this article, we will delve into what bearish divergence is, how to identify it, and provide actionable tips to help you trade it profitably.
What Is a Bearish Divergence?
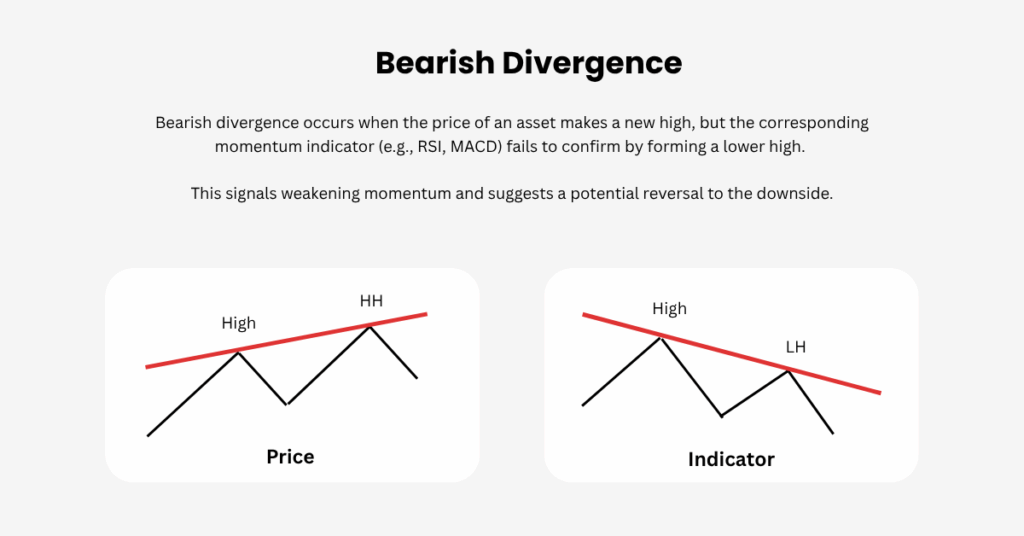
Bearish divergence occurs when the price of an asset makes a higher high, but the accompanying momentum indicator (such as the RSI, MACD, or Stochastic Oscillator) fails to confirm the price action by also making a higher high.
In simple terms, when the price makes a new high, the momentum indicator should also make a new high to confirm the strength behind the move. However, when the indicator prints a lower high while the price continues higher, this signals a potential shift in momentum and a possible trend reversal.
As traders, we’re often advised to “trade what you see.” When price action falls out of sync with momentum indicators, it’s a warning sign that requires attention.
How to Spot the Bearish Divergence
Identifying bearish divergence is relatively straightforward with the right tools. Some of the most popular indicators used to spot divergences include:
Relative Strength Index (RSI)
Moving Average Convergence Divergence (MACD)
Stochastic Oscillator
The good news is that it doesn’t matter which indicator you use, as they all tend to produce the same signals when spotting bearish divergence.
For example, in the case of the NZDJPY 4H chart, despite the indicators being calculated differently, they all pointed to the same signal of a potential market reversal. This consistency across different indicators increases the reliability of the divergence signal.
Trading Bearish Divergence Like a Pro
While bearish divergence can signal a potential market reversal, it is not enough on its own to justify a trade. The psychology behind divergence indicates a shift in momentum, but additional filters should be applied to confirm the setup and avoid false signals.
Let’s walk through a step-by-step breakdown of how to trade it effectively:
Step-by-Step Breakdown
Identify the Overall Trend The best bearish divergence setups occur during a counter-trend pullback within a dominant trend. For example, let’s look at the NZDUSD pair. The market is in a clear downtrend, with the price pulling back to the $0.64200 support level. This pullback is considered a value retracement within the trend.
Look for Resistance at Key Levels As the price rises to $0.66000, it prints a short-term high and then pulls back to $0.64500. At this point, there is still no valid setup. However, we have two critical conditions: (1) an overextended move (2) price approaching a key resistance level. These two conditions should be present before looking for divergence.
Monitor for Price Breakout and Indicator Confirmation If the price breaks the $0.66000 resistance, the RSI should confirm the breakout by printing a higher high. However, a failed breakout where the price goes above the resistance but fails to sustain the momentum can enhance the odds of a bearish divergence setup. Retail traders often get stuck buying the breakout, and when the market reverses, these traders are forced to exit their positions, which can accelerate the downside move.
Spot the Divergence When the price makes a higher high, but the RSI prints a lower high, this is the bearish divergence signal. The market’s upward momentum has fizzled out, and the bearish divergence indicates that the buying pressure is weakening. This is the perfect time to enter a short position.
Execute the Trade and Reap the Rewards After confirming the bearish divergence, the market sells off by more than 100 pips, validating the trade setup.
Key Takeaways for Trading Bearish Divergence
Overextended Counter-Trend Moves: Look for counter-trend rallies that have reached a key resistance level.
Divergence Confirmation: Wait for the momentum indicator (e.g., RSI, MACD) to fail to confirm the price action and show a lower high.
Market Context: Bearish divergence works best when the market is in an overall bearish trend, and the divergence occurs during a short-term pullback.
Confirmation with Other Indicators: While divergence is powerful, combining it with other technical analysis tools (such as trendlines, candlestick patterns, or support/resistance levels) can improve trade accuracy.
Conclusion
Bearish divergence is a powerful trading concept, especially when used in the right market context. When executed properly, it allows traders to identify high-probability, low-risk shorting opportunities. By waiting for confirmation, considering the overall trend, and applying proper risk management strategies, traders can take advantage of market reversals and maximize their trading potential.
By following the steps outlined in this article and applying the principles of bearish divergence, you’ll be better equipped to make informed trading decisions and manage risk effectively.
Share Now
Disclaimer:This content is provided for informational purposes only and does not constitute, and should not be construed as, financial, investment, or other professional advice. No statement or opinion contained herein should be considered a recommendation by Ultima Markets or the author regarding any specific investment product, strategy, or transaction. Readers are advised not to rely solely on this material when making investment decisions and should seek independent advice where appropriate.
Thank you for visiting the Ultima Markets website. Please note that this website is intended for individuals residing in jurisdictions where access is permitted by law. Ultima and its affiliated entities do not operate in your home jurisdiction.
By clicking ‘Acknowledge’, you confirm that you are entering this website solely on your own initiative and not as a result of any specific marketing outreach. You wish to obtain information from this website based on reverse solicitation principles, in accordance with the applicable laws of your home jurisdiction.