This website is managed by Ultima Markets’ international entities, and it’s important to emphasise that they are not subject to regulation by the FCA in the UK. Therefore, you must understand that you will not have the FCA’s protection when investing through this website – for example:
You will not be guaranteed Negative Balance Protection
You will not be protected by FCA’s leverage restrictions
You will not have the right to settle disputes via the Financial Ombudsman Service (FOS)
You will not be protected by Financial Services Compensation Scheme (FSCS)
Any monies deposited will not be afforded the protection required under the FCA Client Assets Sourcebook. The level of protection for your funds will be determined by the regulations of the relevant local regulator.
Note: UK clients are kindly invited to visit https://www.ultima-markets.co.uk/. Ultima Markets UK expects to begin onboarding UK clients in accordance with FCA regulatory requirements in 2026.
If you would like to proceed and visit this website, you acknowledge and confirm the following:
1.The website is owned by Ultima Markets’ international entities and not by Ultima Markets UK Ltd, which is regulated by the FCA.
2.Ultima Markets Limited, or any of the Ultima Markets international entities, are neither based in the UK nor licensed by the FCA.
3.You are accessing the website at your own initiative and have not been solicited by Ultima Markets Limited in any way.
4.Investing through this website does not grant you the protections provided by the FCA.
5.Should you choose to invest through this website or with any of the international Ultima Markets entities, you will be subject to the rules and regulations of the relevant international regulatory authorities, not the FCA.
Ultima Markets wants to make it clear that we are duly licensed and authorised to offer the services and financial derivative products listed on our website. Individuals accessing this website and registering a trading account do so entirely of their own volition and without prior solicitation.
By confirming your decision to proceed with entering the website, you hereby affirm that this decision was solely initiated by you, and no solicitation has been made by any Ultima Markets entity.
Ultima Markets does not have an establishment in Singapore and does not operate from Singapore.
Ultima Markets does not provide products or services to citizens or residents of Singapore, and account applications from Singapore citizens or residents will not be accepted.
If you are a citizen or resident of Singapore, please do not open an account or use Ultima Markets’ products or services.
By selecting “Acknowledge and Continue Browsing”, you confirm that you are accessing this website on your own initiative and that your access is not the result of any direct marketing, targeted advertising, solicitation, or promotional activity by Ultima Markets.
Nothing on this website constitutes an offer, solicitation, or promotion of products or services in any jurisdiction where such activity is prohibited. You are responsible for ensuring that your access to and use of this website complies with applicable local laws and regulations.
Learn how the double top pattern signals potential reversals, how to spot it on charts, and how traders use entries, stops and targets to manage risk.
How to Trade the Double Top Pattern?
The double top pattern is one of the most recognisable bearish reversal patterns in technical analysis. It appears after an uptrend when price fails twice at a similar resistance level and then breaks lower. Because the double top pattern gives clear reference points for entry, stop loss and targets, many traders use it to plan trades and manage risk more systematically.
This guide walks through what the double top pattern is, how it forms, how to identify it, and how traders use it in real markets.
What Is a Double Top Pattern
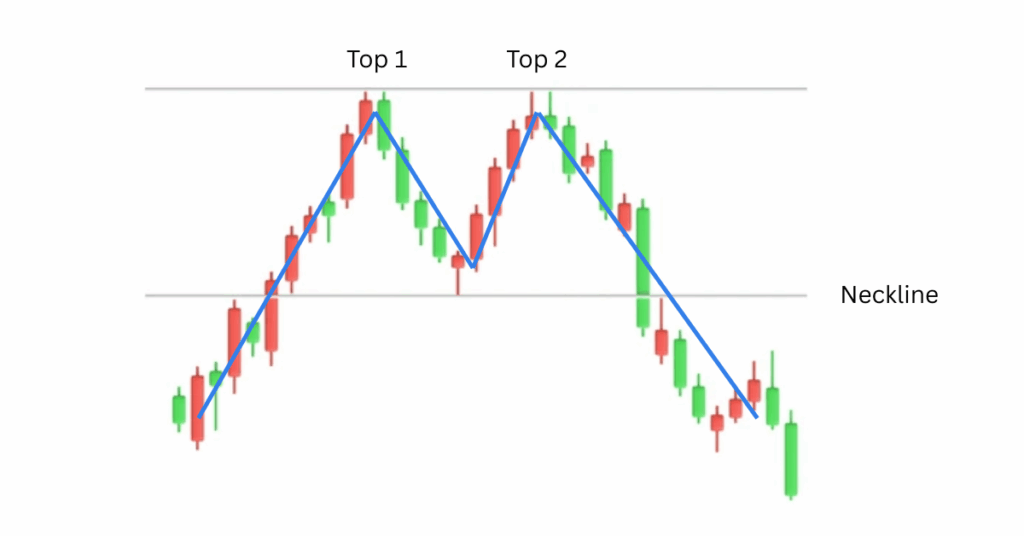
A double top pattern is a bearish reversal formation that suggests an uptrend may be running out of steam. It has three key visual elements:
Two swing highs at roughly the same price
A trough or valley between the highs
A support level at that trough, often called the neckline
The double top pattern is only confirmed when price breaks below the neckline. Until that break happens, the structure is simply a potential pattern, not a completed signal.
Visually, the double top pattern looks like the letter M on the chart, with the neckline running underneath the middle of that shape.
How the Double Top Pattern Forms
Behind the double top pattern is a story about changing market psychology.
Uptrend in place Price has been making higher highs and higher lows. Buyers are in control and dips are being bought.
First top at resistance Price reaches a level where sellers take profits or new supply appears. Momentum slows and the market pulls back. This creates the first peak.
Pullback to neckline The decline from the first top finds support. This low becomes the neckline and marks where buyers step in again.
Second attempt to break higher Price rallies once more and retests the previous high area. This time, buyers fail to push significantly above the first top. The second peak shows that resistance is still strong.
Break of the neckline When price turns lower again and closes below the neckline, many traders see it as confirmation that the uptrend has failed. Sellers gain control and a new downtrend can start.
In short, the double top pattern reflects two failed attempts to break resistance, followed by a shift in control from buyers to sellers.
How to Identify a Double Top Pattern on Charts
Not every pair of highs is a valid double top pattern. Traders often use a checklist to filter out weaker structures.
Double top pattern checklist
When you think you see a double top pattern, look for:
Clear prior uptrend The pattern should follow a visible move higher. Without an uptrend there is nothing to reverse.
Two similar highs The peaks should be at roughly the same price level. A small difference is normal, but a large gap makes the pattern less reliable.
A clear trough between peaks There should be a visible pullback between the highs, not just a tiny pause. This trough defines the neckline.
Well defined neckline Draw a horizontal or slightly sloping line through the lowest point between the two tops. This is the level that needs to break.
Neckline break for confirmation The double top pattern is confirmed only when price closes below the neckline. Before that, the market can still push to new highs.
Volume behaviour Many textbook examples show fading volume on the second top and increased volume on the break of the neckline. This supports the idea that buying pressure is weakening.
Keep the pattern flexible, not perfect
Real charts rarely print a perfect M shape. The two peaks of a double top pattern may differ slightly in height, the valley may not sit exactly in the middle and the time between peaks can vary. Some double tops form in a few days, while others take weeks or months.
What matters most is the overall story. You want a genuine uptrend, two failed pushes through resistance and a clean break below the neckline, not artistic symmetry.
How Reliable Is the Double Top Pattern
The double top pattern is widely used but it is not a guarantee. Historical research and trader experience suggest a few key points:
Double tops often signal that an uptrend is weakening, but price does not always reach the full projected target.
Some patterns fail completely when price breaks the neckline briefly and then snaps back to new highs.
Larger double top patterns that form over longer timeframes, such as daily or weekly charts, are often considered more reliable than small intraday patterns.
Because of this, many traders treat the double top pattern as a strong warning sign rather than a promise. They use confirmation, conservative position sizing and clear exit rules to manage the inevitable false signals.
How to Trade the Double Top Pattern
There is no single correct way to trade a double top pattern, but most strategies follow similar steps.
1. Entry Strategies
Breakout entry Enter short when price closes clearly below the neckline to confirm the pattern.
Retest entry Wait for a break below the neckline, then enter if price retests the neckline from below and turns down again.
Indicator backed entry Use RSI or MACD for bearish divergence (price retests the high but the indicator makes a lower high) and enter after the neckline break.
2. Stop Loss Placement
Place your stop where the double top pattern would be invalidated:
Just above the second top, or
Slightly above the highest of the two tops to allow for minor spikes.
3. Profit Targets
Use the pattern height as a simple target guide:
Measure the distance from the tops to the neckline.
Project that distance downward from the neckline breakout.
Many traders take partial profit at this level and trail the rest with tools like moving averages or recent swing highs/lows.
Advantages and Limitations of the Double Top Pattern
The double top pattern is a useful tool, but like every pattern it has strengths and weaknesses.
Advantages
Easy to spot Clear M-shaped structure, even for newer traders.
Defined trading levels Tops and neckline give natural entry, stop loss and target zones.
Works on most markets and timeframes Used on forex, stocks, indices, commodities and crypto, from intraday to weekly charts.
Helps manage long positions A double top near resistance can signal it’s time to scale out, tighten stops or hedge.
Limitations
False signals Patterns can fail, especially in strong uptrends, with price snapping back above the neckline.
Subjective to read Traders may disagree on peak symmetry or where to draw the neckline.
Targets are only rough Price may stall before or move beyond the projected target.
Conclusion
Because of this, many traders combine the double top pattern with broader market context and other technical tools rather than using it alone.
In the end, the double top pattern is simply a framework to organise your decisions, not a shortcut to perfect timing. What really makes the difference is how you use it. Observe the quality of your chart reading, how you size your positions, and whether you stick to your rules when the market becomes emotional.
Spend time scrolling through historical charts, mark out past double tops, and note how price behaved before and after each setup. Then test your rules on a demo or small live risk until the process feels natural. When the pattern is backed by preparation, discipline and a clear trading plan, it becomes far more than just an M-shape on the screen. It becomes another way to trade with intention instead of impulse.
Share Now
Disclaimer:This content is provided for informational purposes only and does not constitute, and should not be construed as, financial, investment, or other professional advice. No statement or opinion contained herein should be considered a recommendation by Ultima Markets or the author regarding any specific investment product, strategy, or transaction. Readers are advised not to rely solely on this material when making investment decisions and should seek independent advice where appropriate.
Thank you for visiting the Ultima Markets website. Please note that this website is intended for individuals residing in jurisdictions where access is permitted by law. Ultima and its affiliated entities do not operate in your home jurisdiction.
By clicking ‘Acknowledge’, you confirm that you are entering this website solely on your own initiative and not as a result of any specific marketing outreach. You wish to obtain information from this website based on reverse solicitation principles, in accordance with the applicable laws of your home jurisdiction.